Quick Start
This chapter walks through your first pipe-to-plot workflow. By the end you will have gone from raw tabular data to a rendered terminal plot in a single command.
Your first plot
The simplest way to use uplot is to pipe tab-separated data into it. Create a small dataset and draw a bar chart:
printf "Ruby\t65\nPython\t85\nRust\t90\nGo\t70\nJava\t60\n" | uplot bar -t Languages
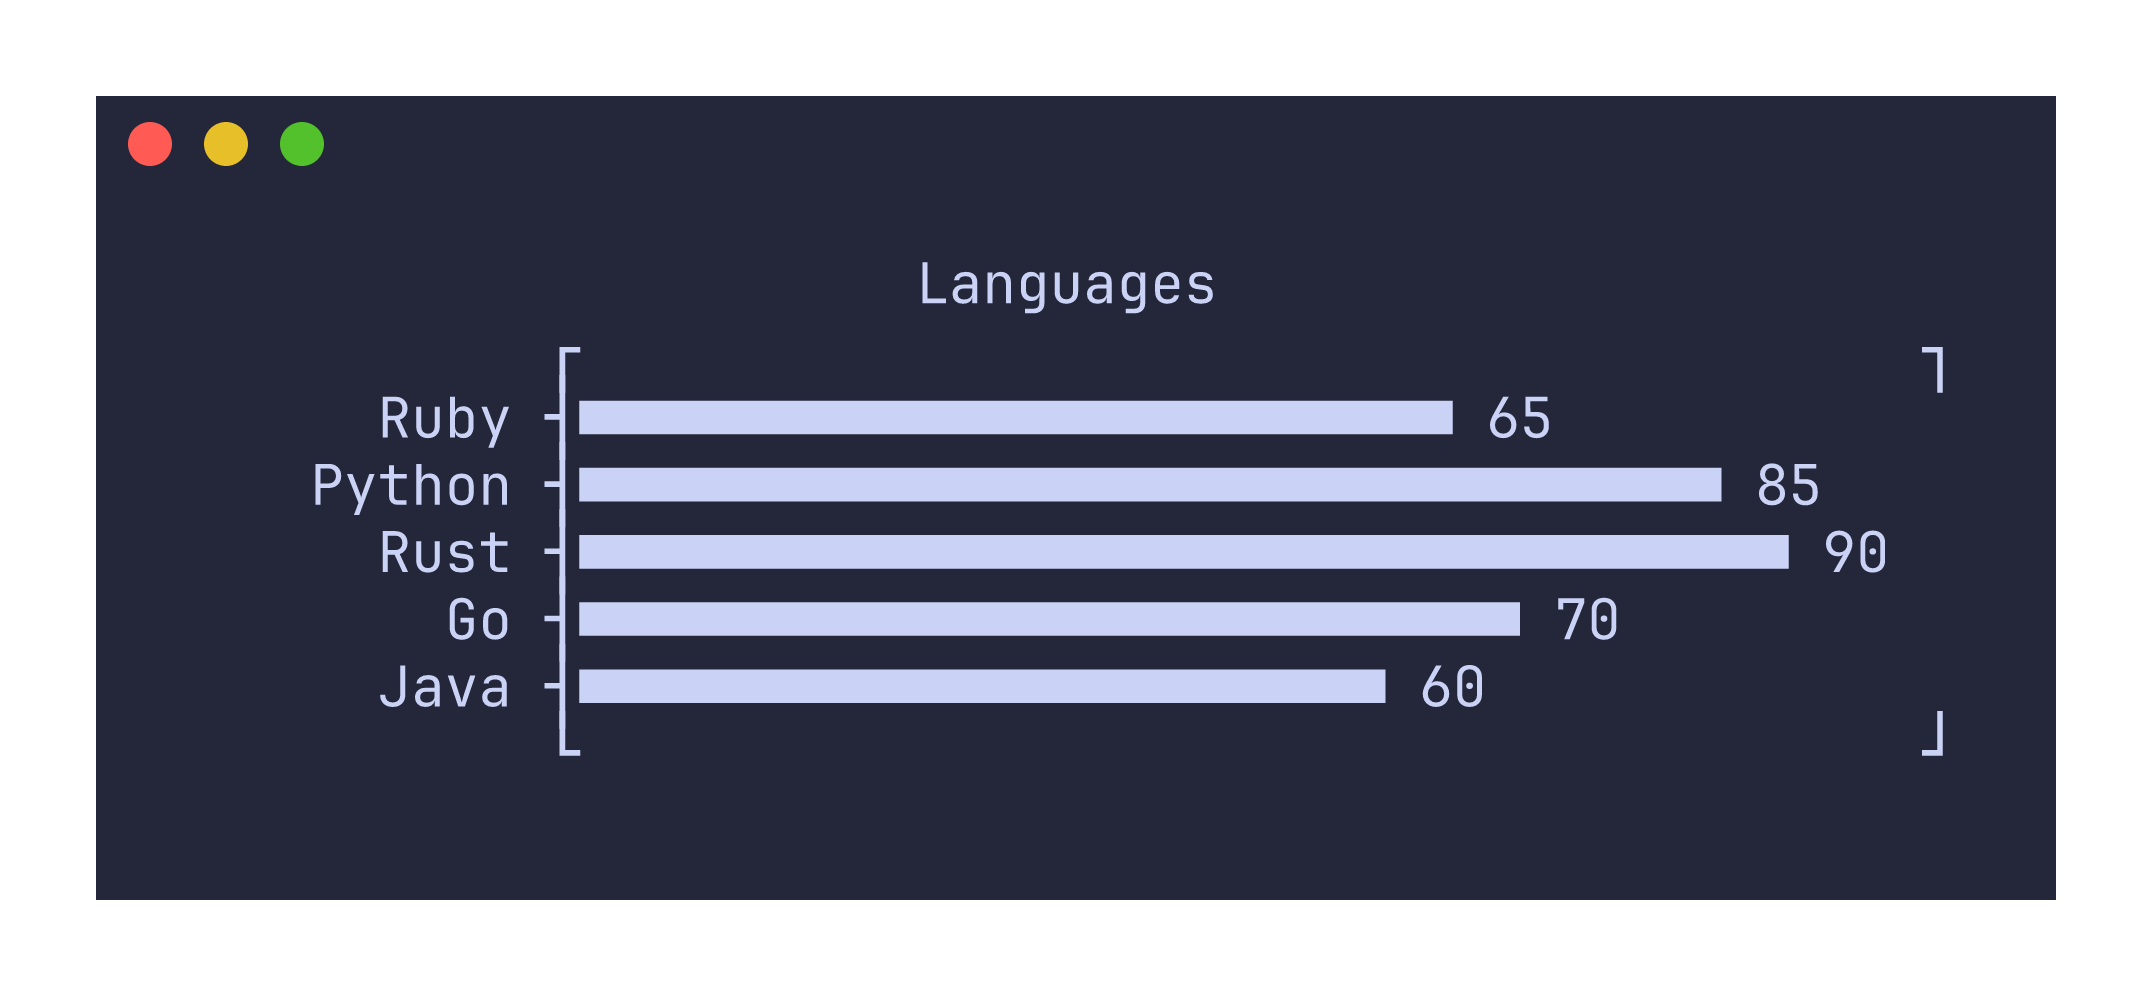
The first column provides the labels and the second column provides the values. The plot appears on stderr by default, so it does not interfere with further pipeline processing.
Plotting numeric sequences
For line plots, you can pipe a single column of numbers and let uplot use the row index as the x-axis:
seq 100 | awk '{print sin($1/10)}' | uplot line
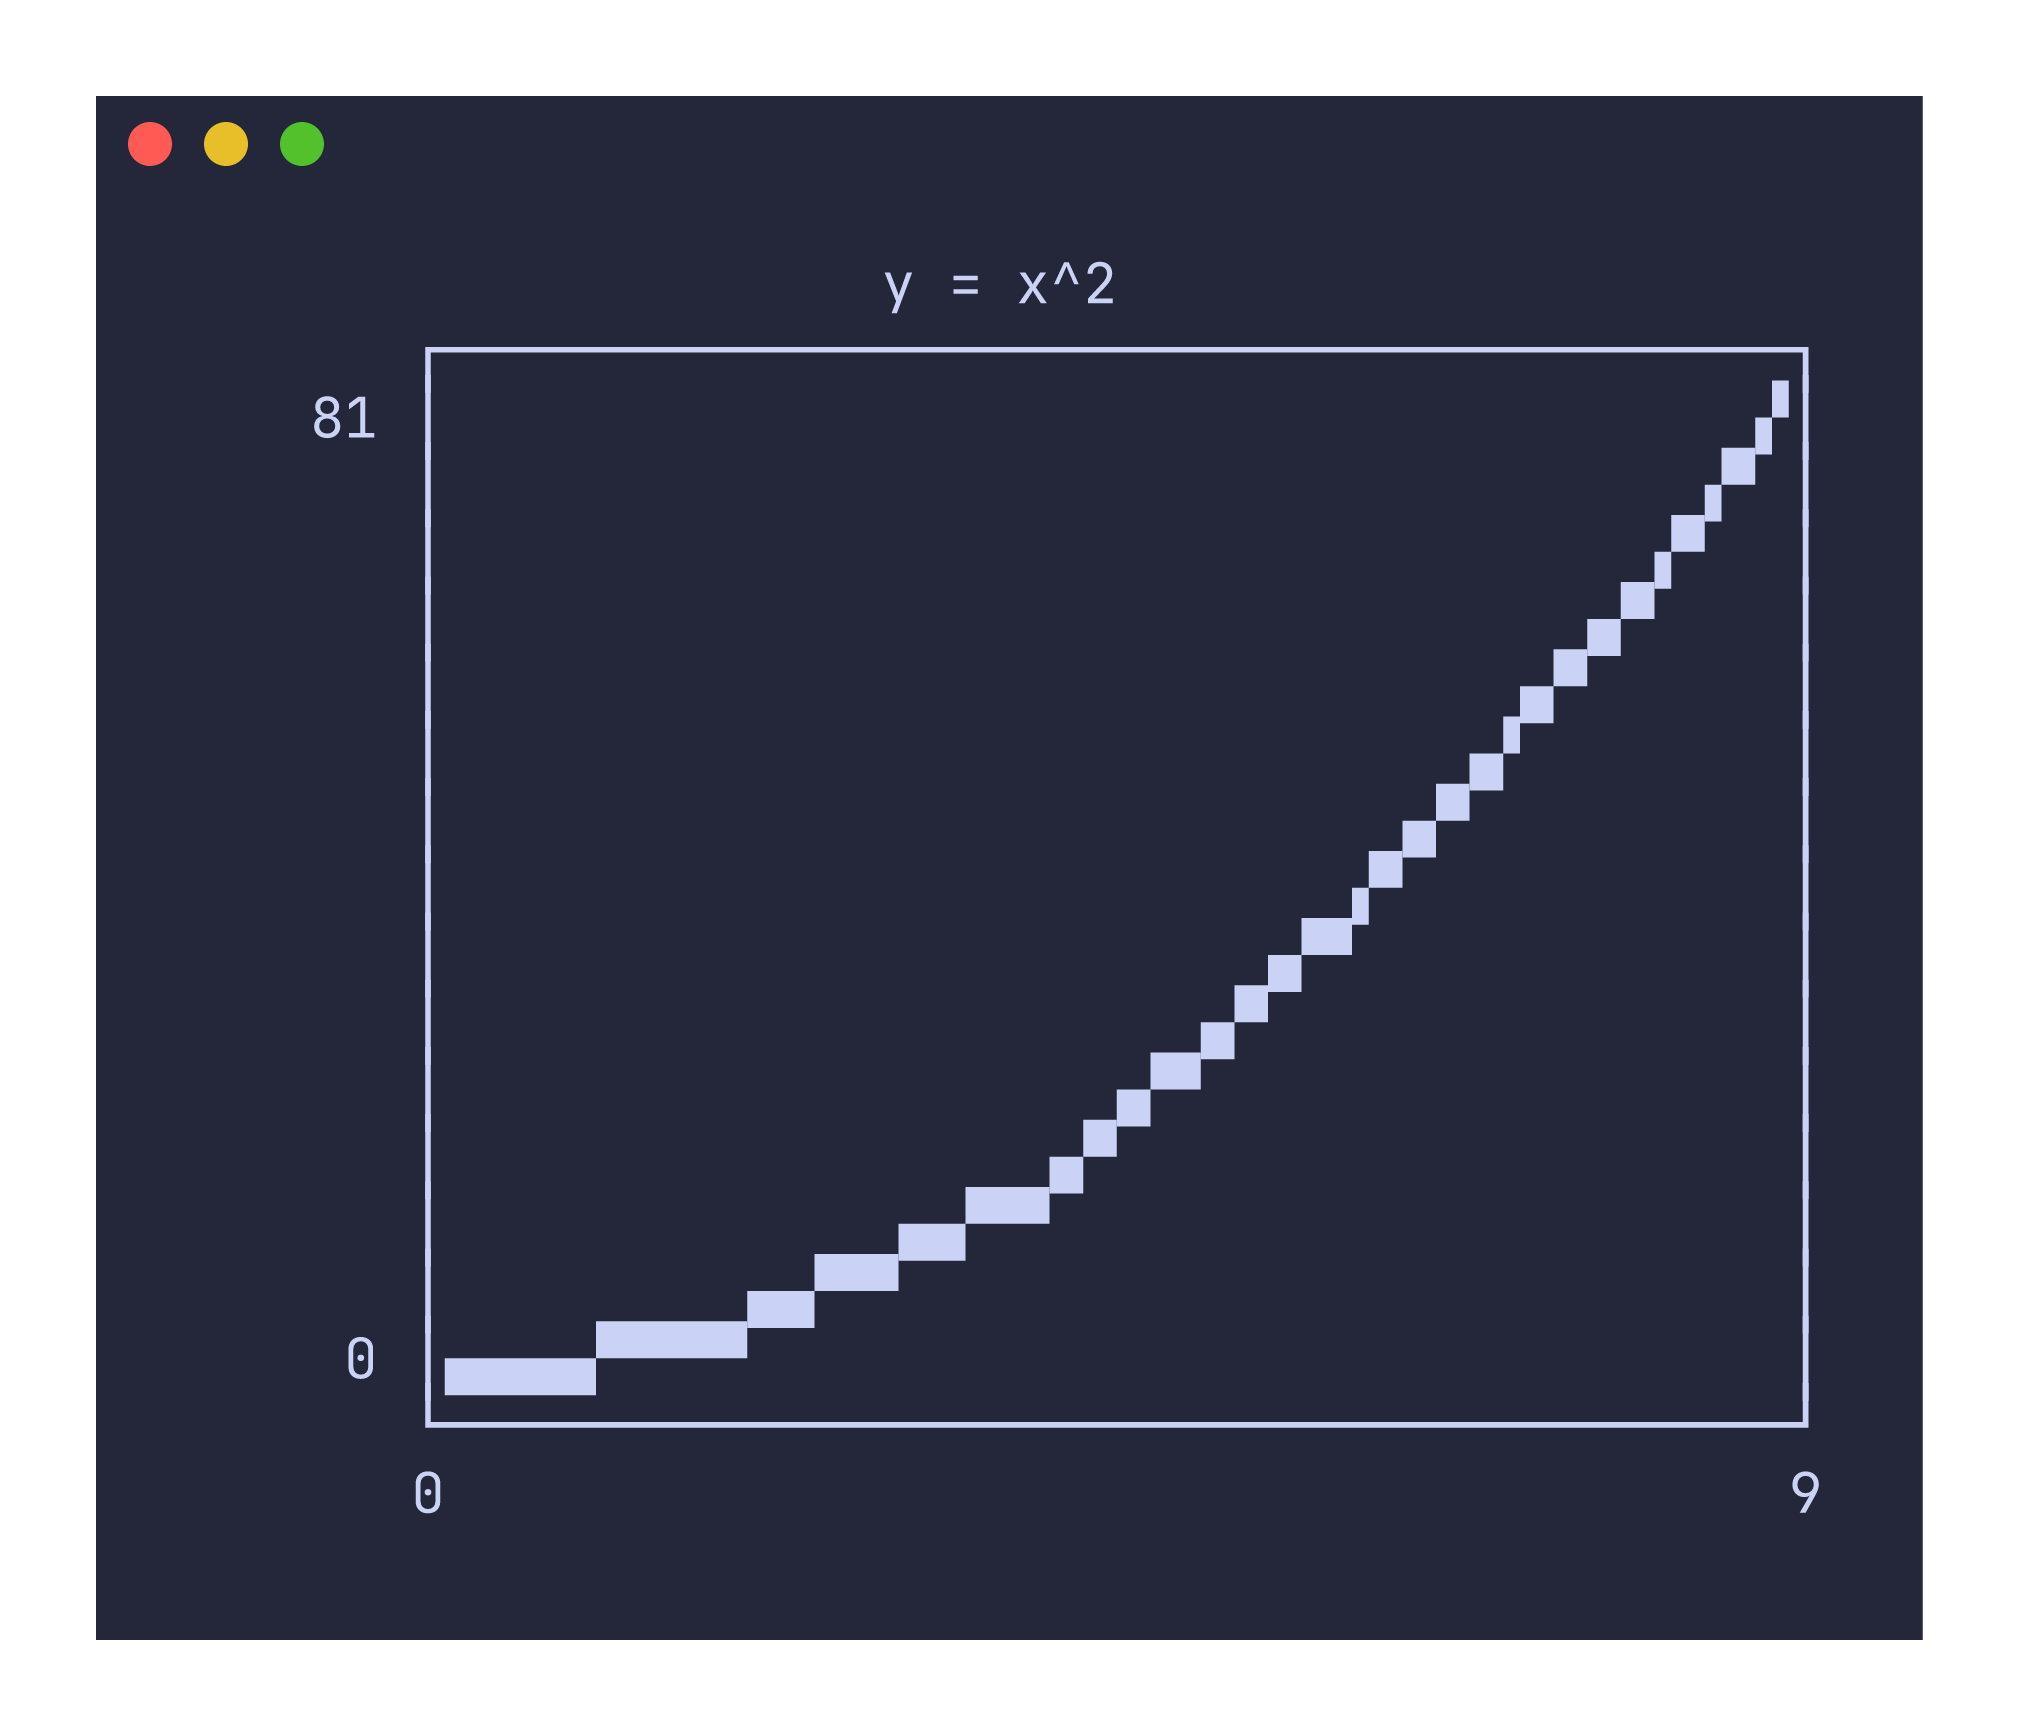
Or provide two columns for explicit x and y values:
printf "0\t0\n1\t1\n2\t4\n3\t9\n4\t16\n5\t25\n6\t36\n7\t49\n8\t64\n9\t81\n" | uplot line --canvas block -t "y = x^2"
Working with CSV files
Real-world data usually lives in CSV files with headers. Use -H to treat the first row as column headers and -d, to set the delimiter to a comma:
uplot hist -H -d, -t "Sepal Length" < iris.csv
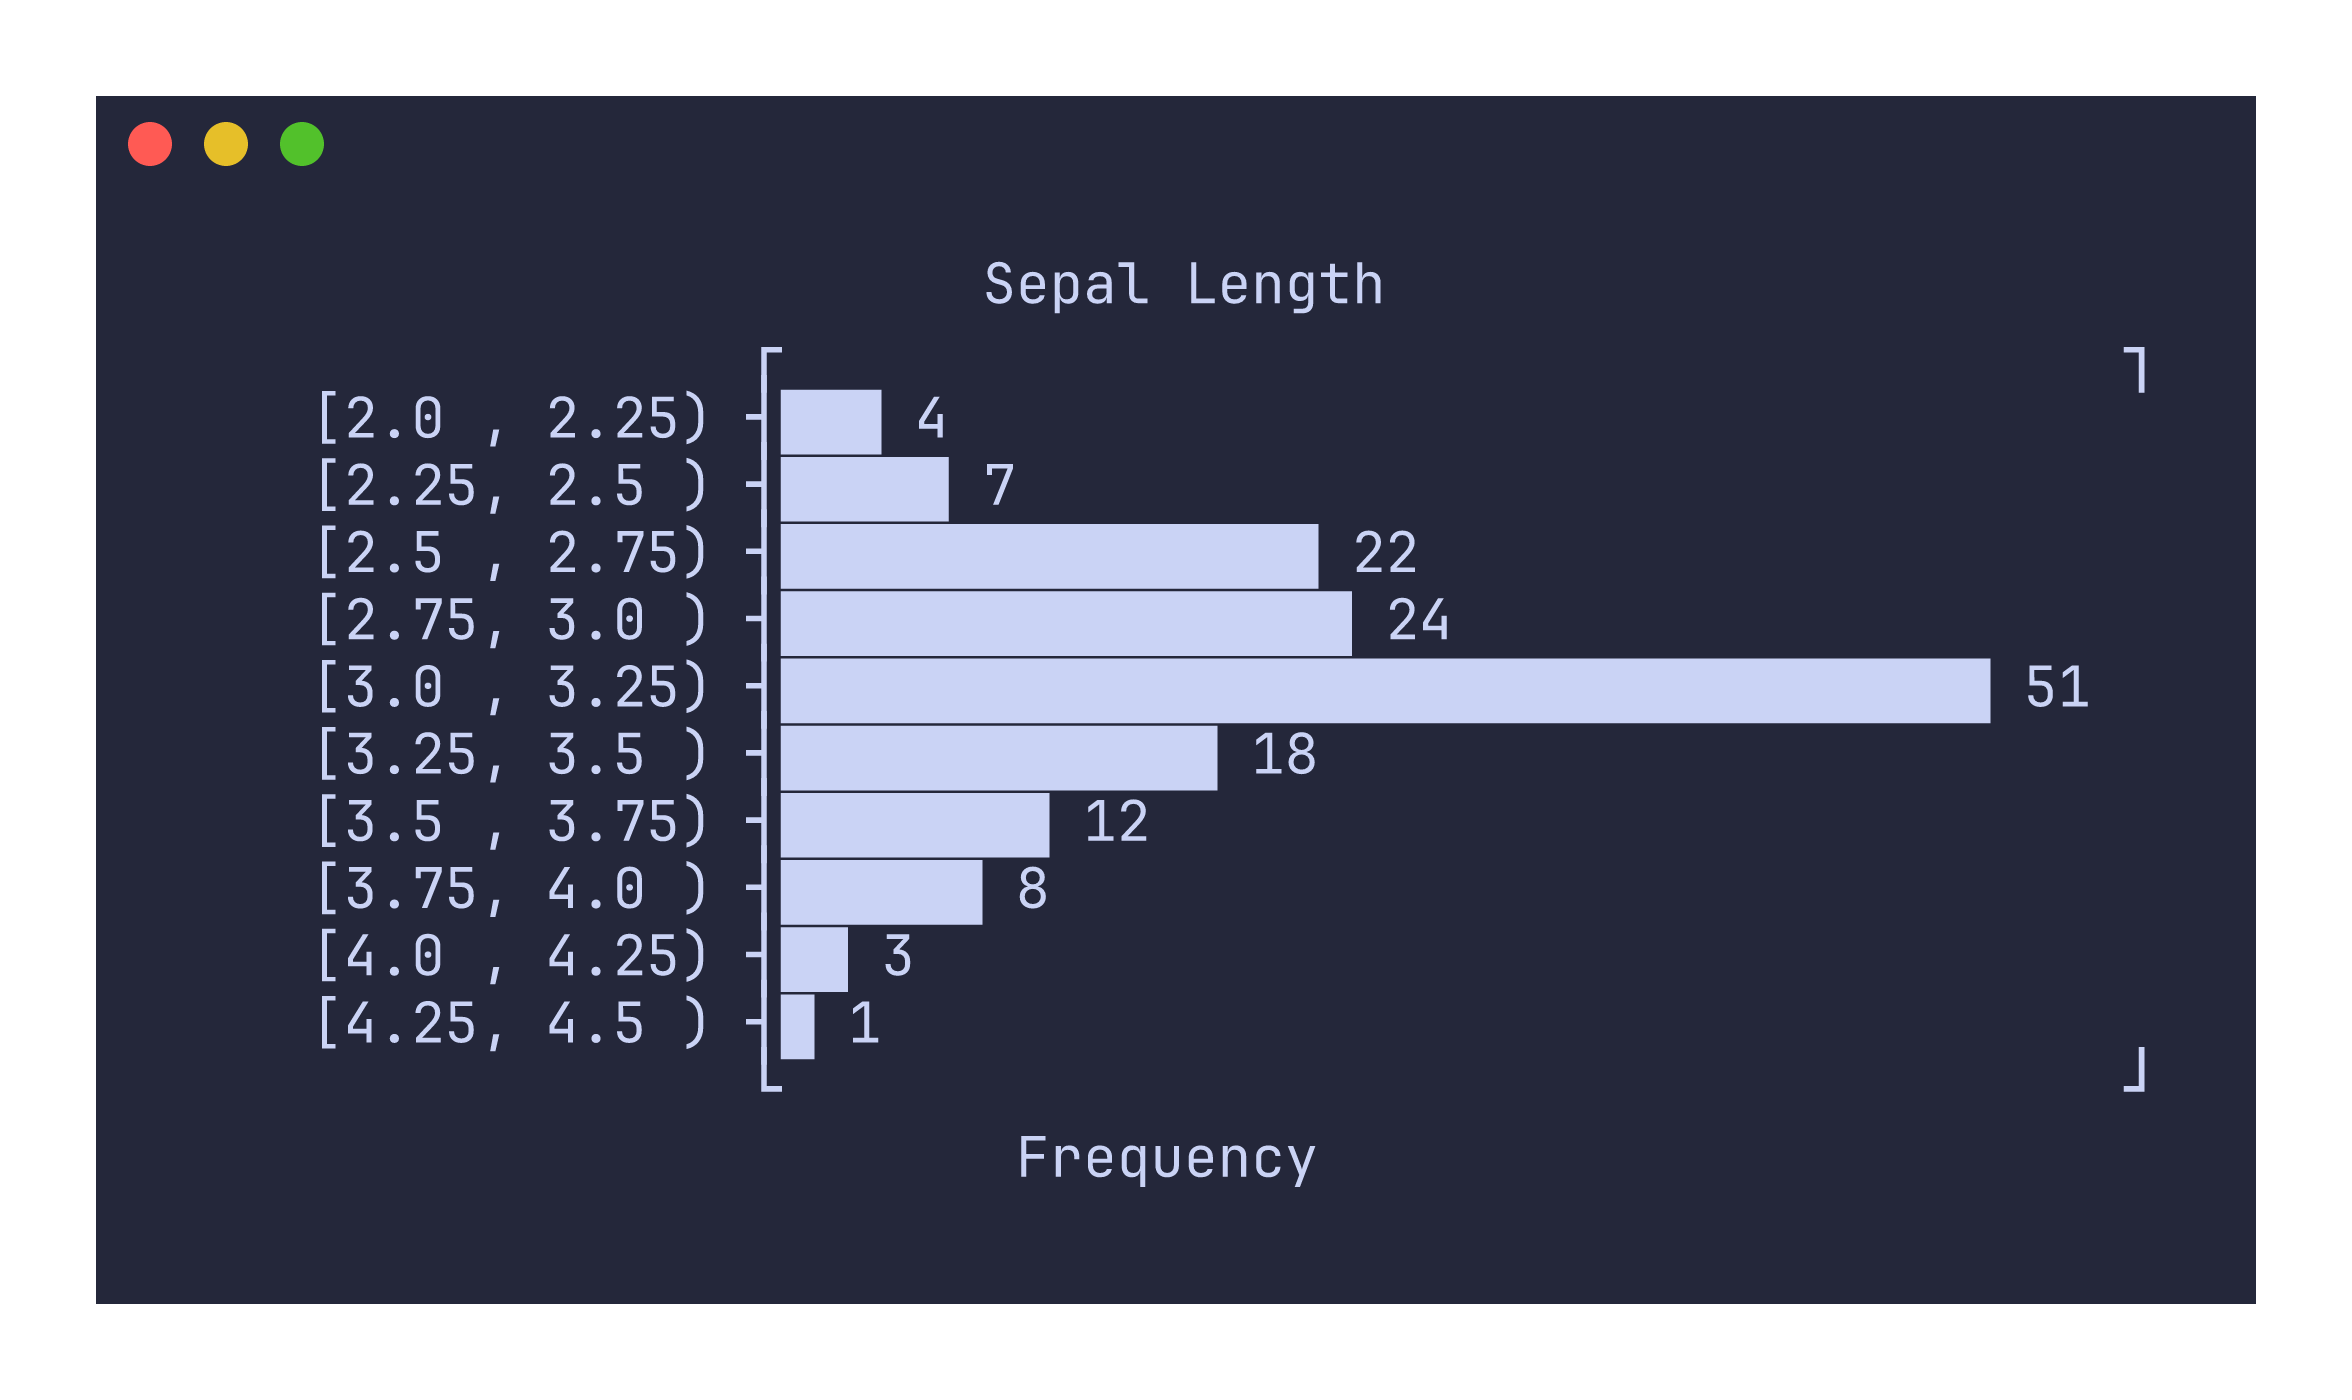
The -H flag tells uplot to use the header row for axis labels and legend names. Without it, the first row would be treated as data.
Choosing a canvas
By default, line plots, scatter plots, and density plots use the braille canvas, which provides the highest resolution (2x4 pixels per character cell). You can switch to other canvas types depending on your font support and aesthetic preferences:
uplot line --canvas block < data.tsv   # 2x2 block elements
uplot line --canvas ascii < data.tsv   # 3x3 ASCII art
uplot line --canvas dot < data.tsv     # simple dot characters
uplot line --canvas density < data.tsv # density shading
The block canvas is a good default if your terminal does not render braille patterns well. The density canvas is specialized for scatter-like data where overlapping points should appear darker.
What next?
The Commands Reference documents each plot type in detail with usage examples and screenshots. The Options Reference covers every flag. The Recipes/Cookbook shows how to combine uplot with common shell tools for practical data analysis workflows.