bar
Aliases: barplot
The bar command renders a horizontal bar chart from labeled numeric data. It expects two-column input where the first column contains labels and the second column contains numeric values.
Usage
uplot bar [options]
uplot barplot [options]
Input format
The default input format is two tab-separated columns: labels in the first column and numeric values in the second. Use -d to change the delimiter.
Ruby	65
Python	85
Rust	90
Go	70
Java	60
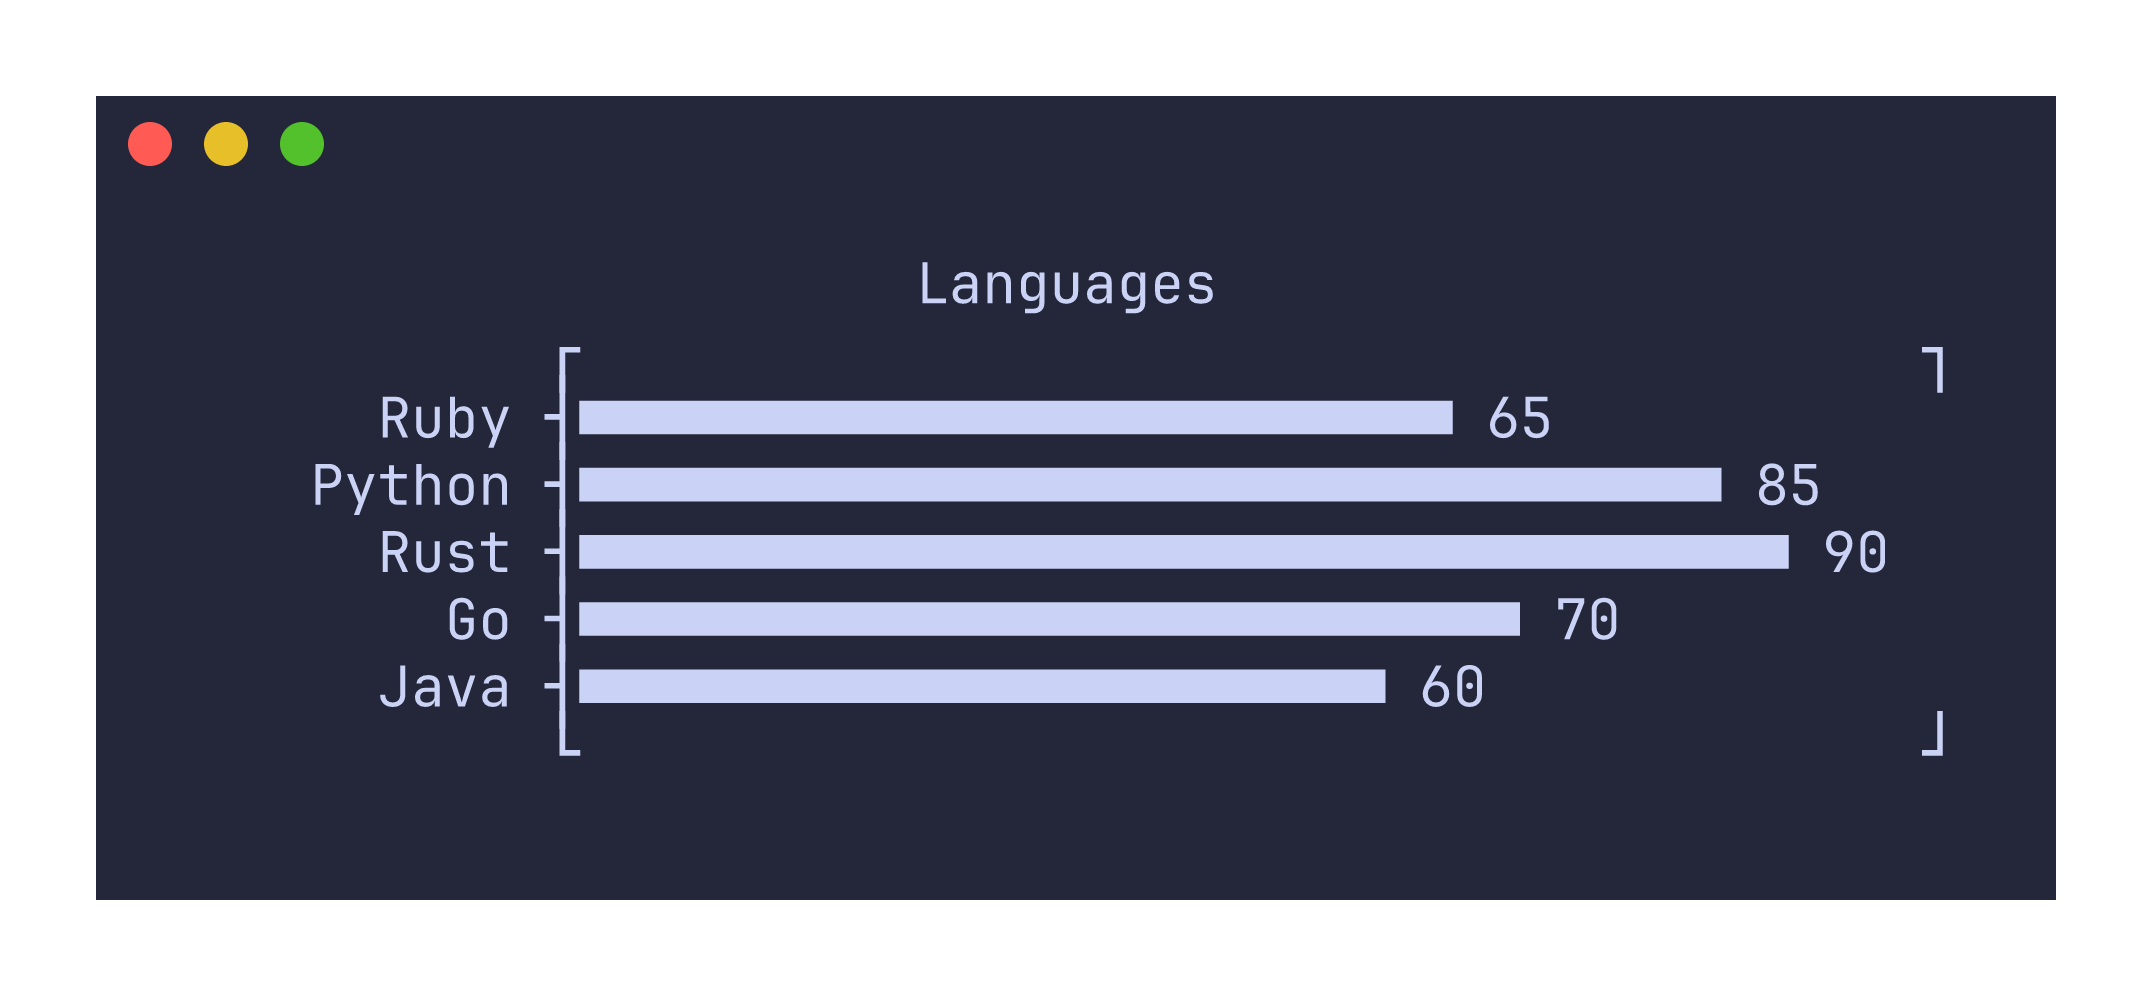
Example
printf "Ruby\t65\nPython\t85\nRust\t90\nGo\t70\nJava\t60\n" | uplot bar -t Languages
Command-specific options
| Flag | Description |
|---|---|
--symbol <CHAR> | Use a custom character for bar fill instead of the default ■ |
--xscale <SCALE> | Apply a scale transform to bar lengths: log10 for logarithmic scaling |
The default rendering repeats the ■ character to fill each bar. You can substitute a different character with --symbol, for example --symbol '#' for plain ASCII output. If you use the library API directly and set symbol to None, bars are rendered with fractional Unicode block characters for sub-character-width resolution, but this mode is not exposed through the CLI.
Logarithmic scaling with --xscale log10 transforms bar lengths but preserves the original numeric labels on the axis, so the visual proportions reflect the log scale while the displayed values remain in the original units.
The border style defaults to barplot (which includes tick marks on the left edge) rather than the solid border used by other plot types. You can override this with -b solid or -b corners if you prefer a different frame.
Negative values produce an error rather than being silently clamped. If all values are zero, the chart renders with empty bars.