count
Aliases: c
The count command tallies occurrences of each unique value in a single-column input and renders the result as a horizontal bar chart. It is a convenience command that combines value counting with bar chart rendering in one step.
Usage
uplot count [options]
uplot c [options]
Input format
A single column of categorical values, one per line:
apple
banana
apple
cherry
banana
apple
Example
printf "apple\nbanana\napple\ncherry\nbanana\napple\nbanana\ncherry\ncherry\ncherry\n" | uplot c -t "Fruit Count"
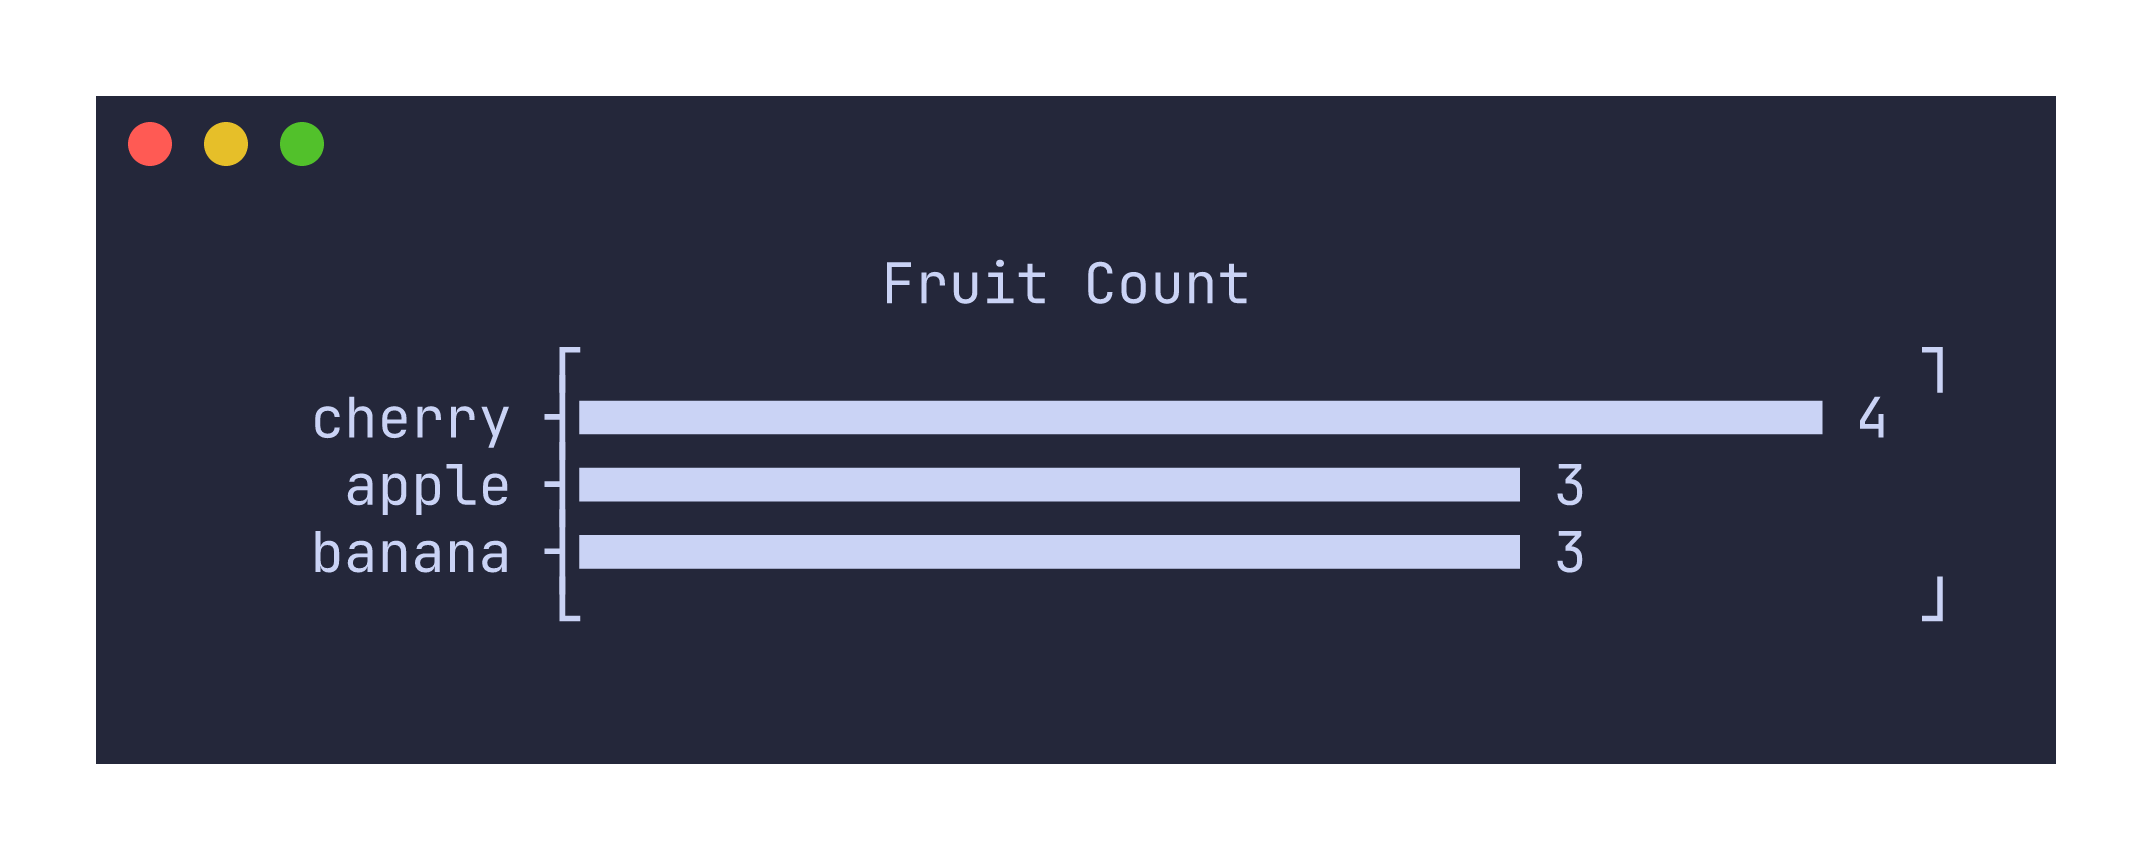
Sorting behavior
By default, values are sorted in descending order by count. When two values have the same count, they are sorted alphabetically. Use -r or --reverse to reverse the sort order so that the least frequent values appear first.
printf "a\nb\na\nc\nb\na\n" | uplot c -r
Command-specific options
| Flag | Description |
|---|---|
--symbol <CHAR> | Custom bar fill character |
--xscale <SCALE> | Scale transform for bar lengths (e.g., log10) |
-r, --reverse | Reverse the sort order (ascending by count) |
The count command reads only the first column of input. If your data has multiple columns, only the first one is used for counting. Headers (-H) are supported and the header value will be used as the plot title if no explicit -t flag is provided.