histogram
Aliases: hist
The histogram command computes a frequency distribution from numeric data and renders it as a horizontal bar chart with interval labels. It automatically determines bin edges and counts values falling into each interval.
Usage
uplot hist [options]
uplot histogram [options]
Input format
A single column of numeric values, or a multi-column dataset where the first numeric column is used:
4.7
5.1
3.8
6.2
5.5
For CSV files with headers, the first numeric column is selected automatically:
uplot hist -H -d, < iris.csv
Example
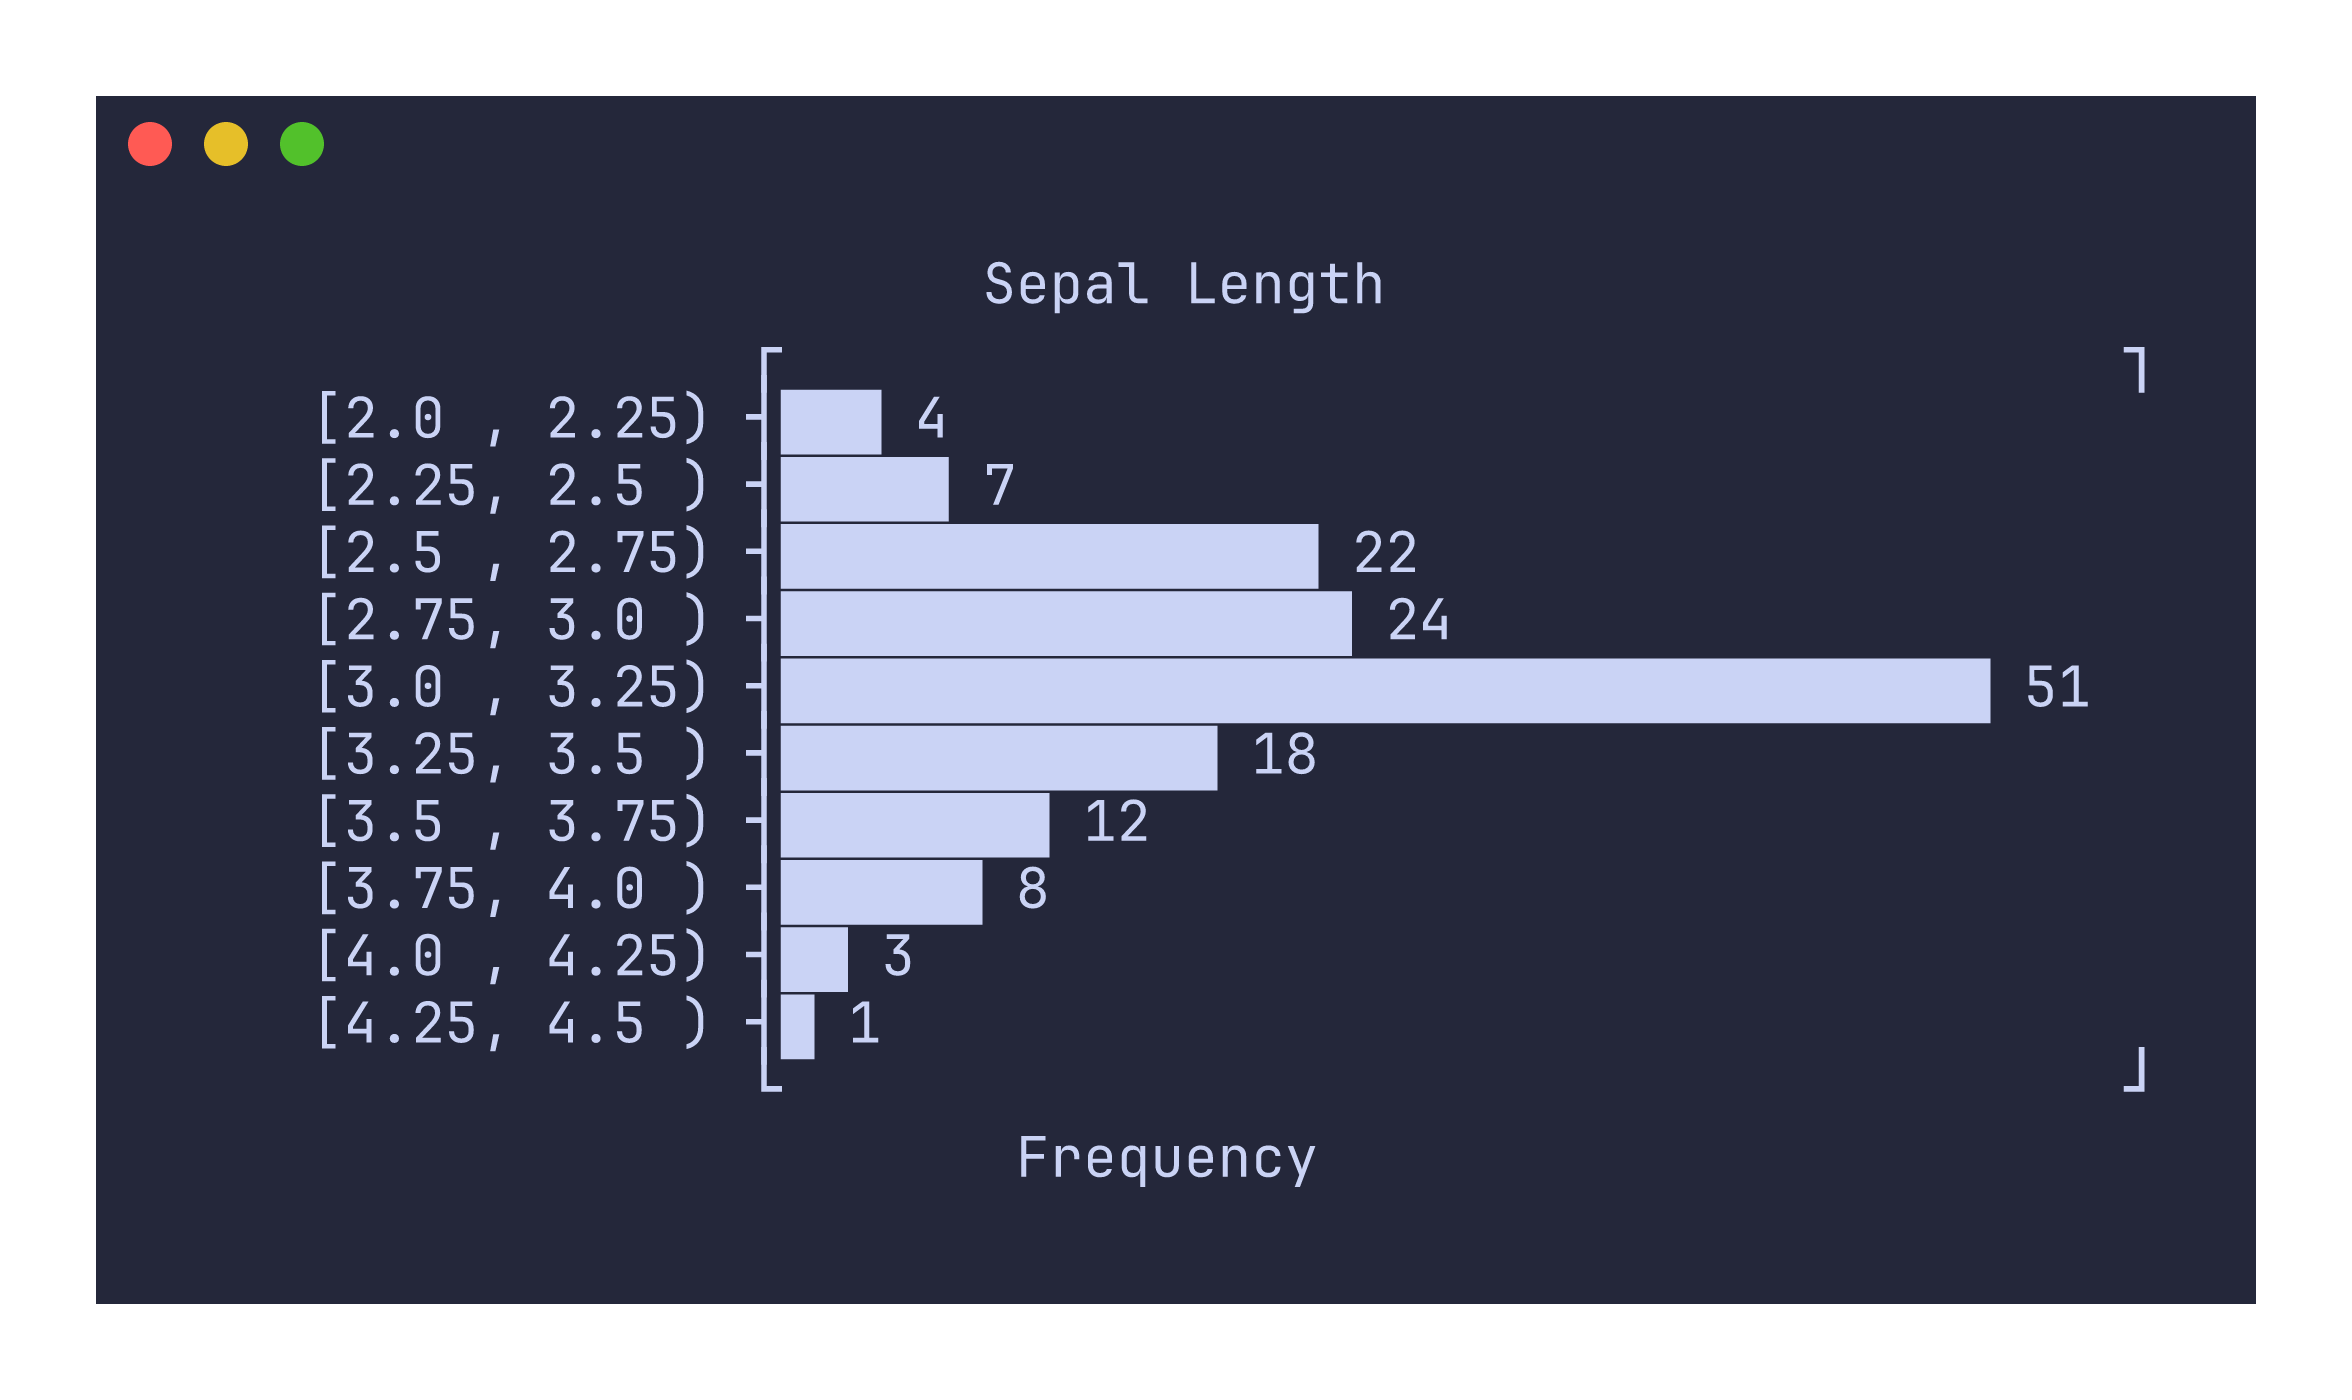
uplot hist -H -d, -t "Sepal Length" < iris.csv
Binning
The default number of bins is computed using Sturges’ rule: ceil(log2(n) + 1), where n is the number of data points. You can override this with the -n flag:
uplot hist -n 5 -H -d, < iris.csv
Interval closure
By default, intervals are left-closed: [a, b). The last bin is always fully closed [a, b] to include the maximum value. You can switch to right-closed intervals (a, b] with the --closed flag:
uplot hist --closed right -H -d, < iris.csv
Command-specific options
| Flag | Description |
|---|---|
-n, --nbins <N> | Number of bins (default: Sturges’ rule) |
--closed <SIDE> | Interval closure: left (default) or right |
--symbol <CHAR> | Bar fill character (default: \u{2587}) |
The x-axis label defaults to “Frequency”. Interval labels are formatted with aligned decimal precision so that all bin boundaries line up visually, with precision derived from the bin width to avoid unnecessary trailing digits.