line
Aliases: lineplot, l
The line command renders a single-series line plot by connecting consecutive data points with line segments on a Unicode canvas.
Usage
uplot line [options]
uplot lineplot [options]
uplot l [options]
Input format
With a single column, the row index is used as the x-axis and the column values become the y-axis:
0
1
4
9
16
25
With two columns, the first column provides explicit x values and the second provides y values:
0	0
1	1
2	4
3	9
4	16
5	25
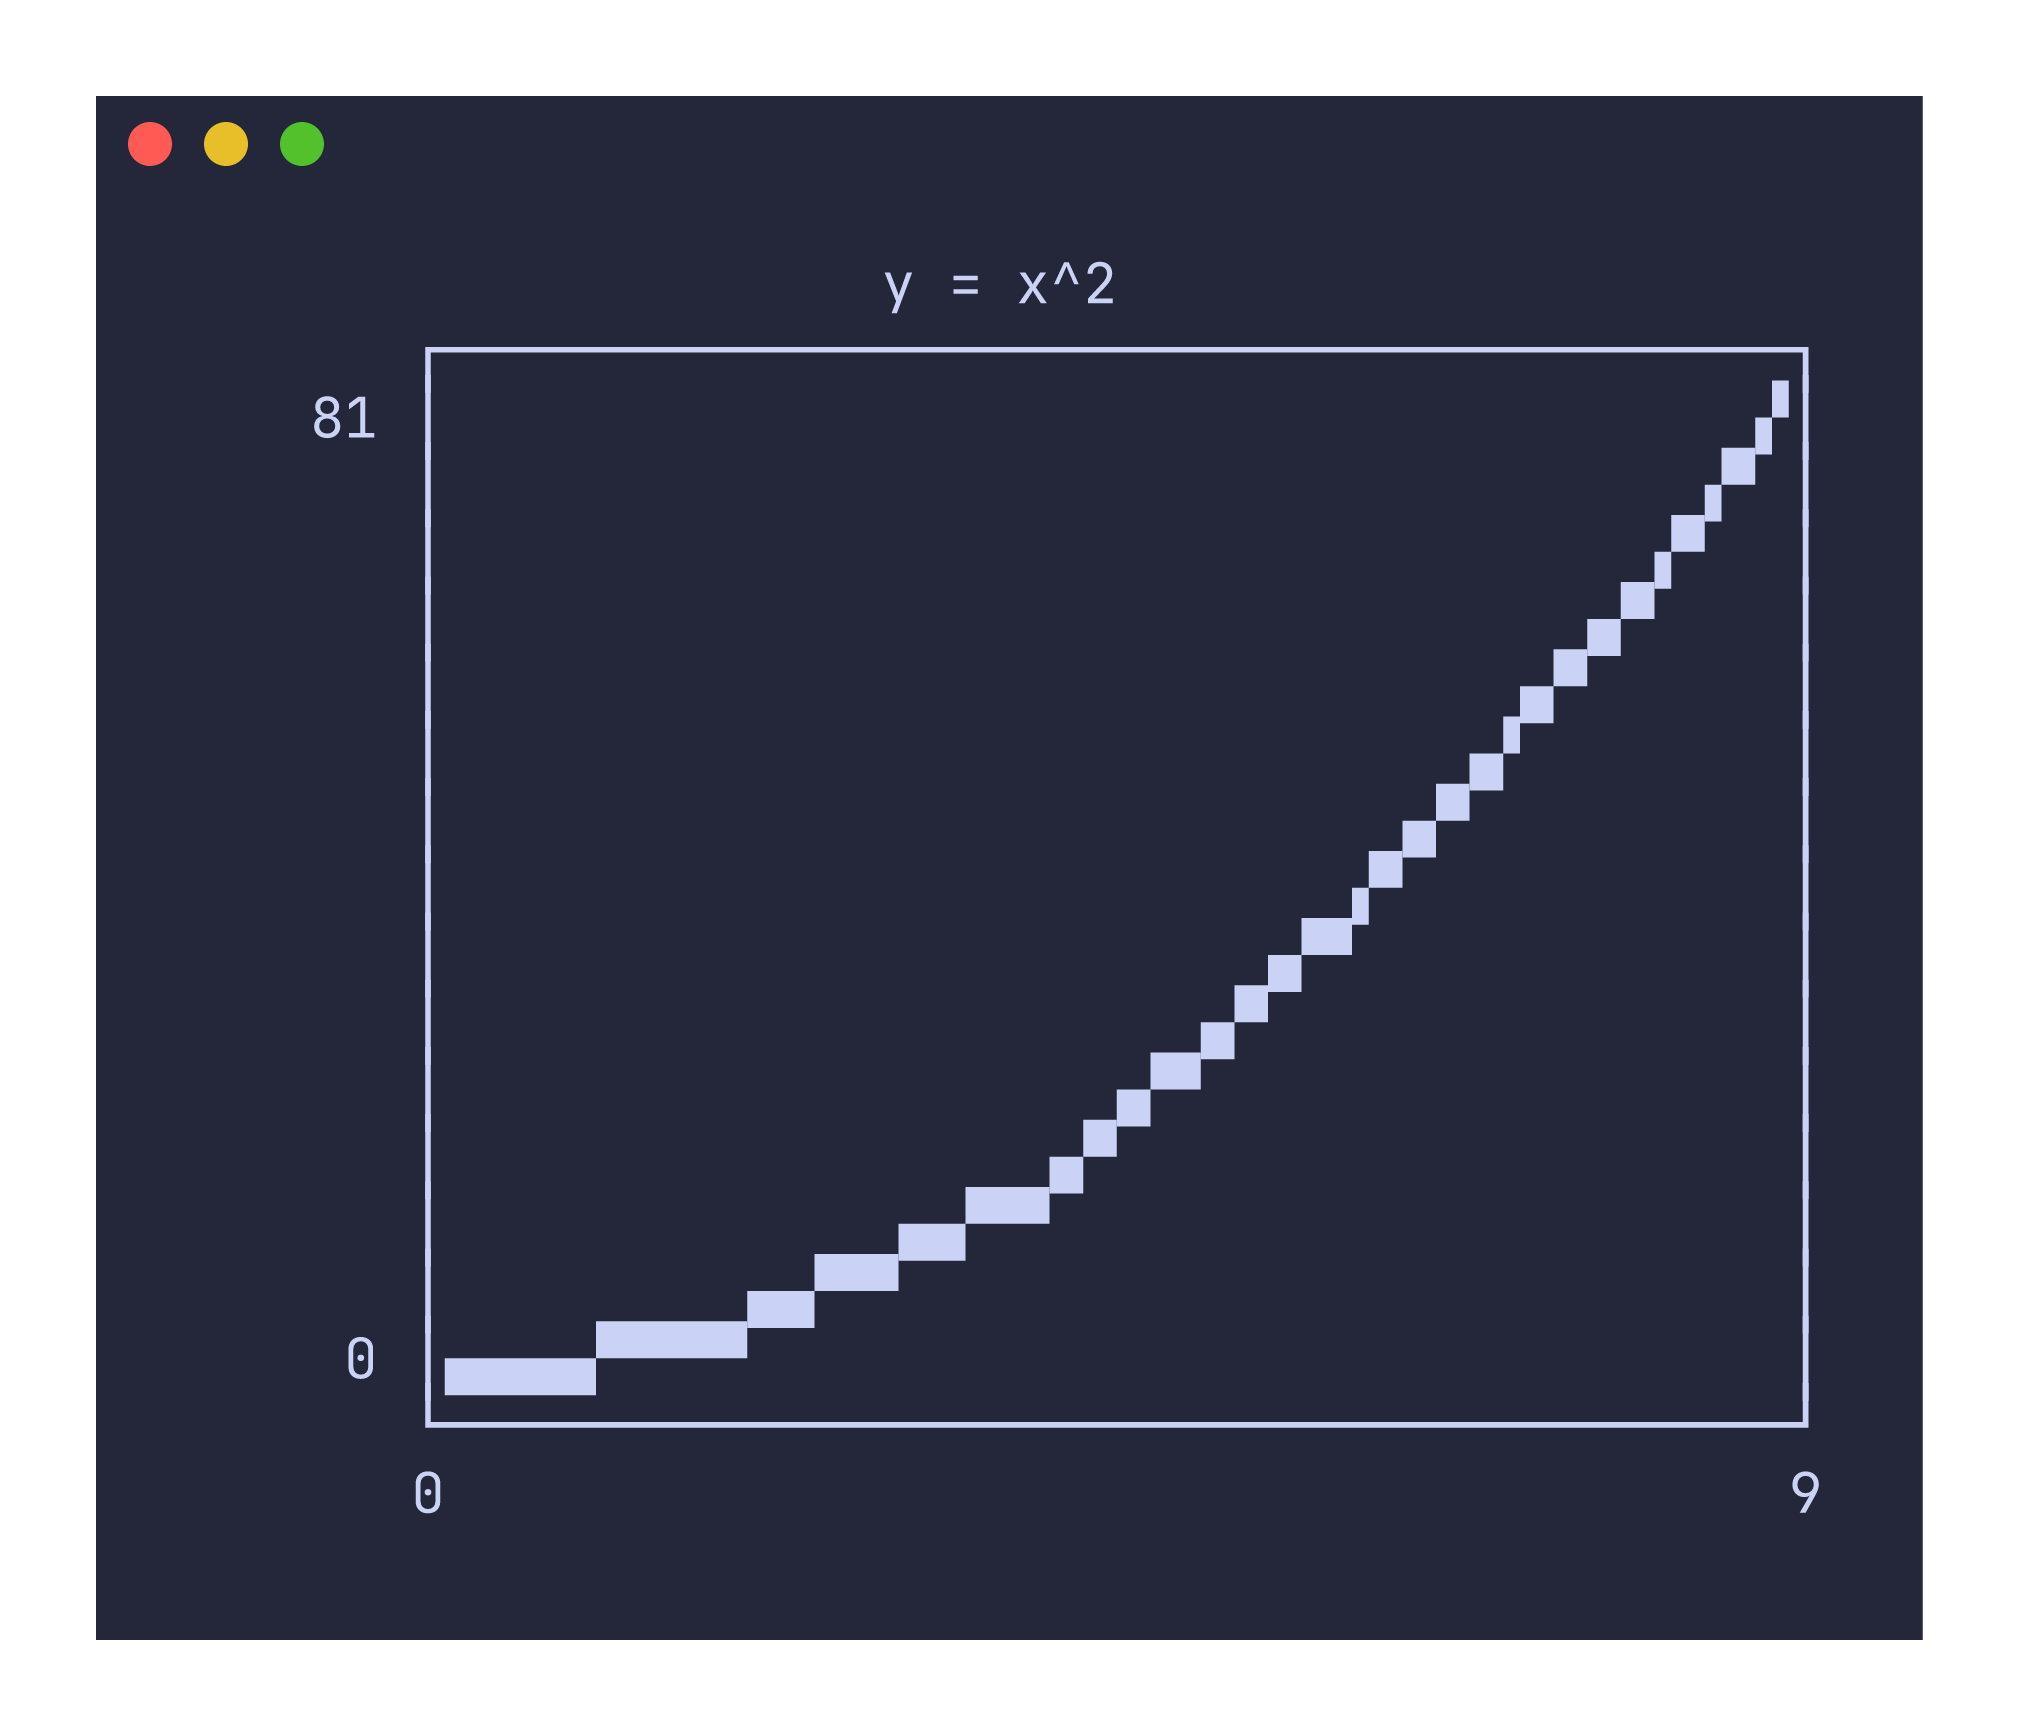
Example
printf "0\t0\n1\t1\n2\t4\n3\t9\n4\t16\n5\t25\n6\t36\n7\t49\n8\t64\n9\t81\n" | uplot line --canvas block -t "y = x^2"
Canvas types
The default canvas is braille, which provides the highest resolution at 2x4 pixels per character cell. Other options trade resolution for broader font compatibility:
uplot line --canvas block < data.tsv   # 2x2 block elements
uplot line --canvas ascii < data.tsv   # 3x3 ASCII approximation
uplot line --canvas dot < data.tsv     # simple dot markers
Grid lines
Grid lines are enabled by default, rendering as tick marks at the x=0 and y=0 axes when they fall within the plot bounds. Disable them with --no-grid:
uplot line --no-grid < data.tsv
Axis limits
By default, axis ranges are determined from the data. You can set explicit bounds to zoom in or out:
uplot line --xlim=0,100 --ylim=-1,1 < data.tsv
Command-specific options
| Flag | Description |
|---|---|
--canvas <TYPE> | Canvas type: braille (default), block, ascii, dot, density |
--grid / --no-grid | Toggle grid lines (default: on) |
--xlim <MIN,MAX> | X-axis limits |
--ylim <MIN,MAX> | Y-axis limits |
--fmt <FORMAT> | Data format: xy (default) or yx to swap columns |
When the input has only one column, uplot treats it as y-only data with implicit x values starting at 0. This makes it easy to plot output from commands that produce a single column of numbers, like seq 100 | awk '{print sin($1/10)}' | uplot line.