lines
Aliases: lineplots, ls
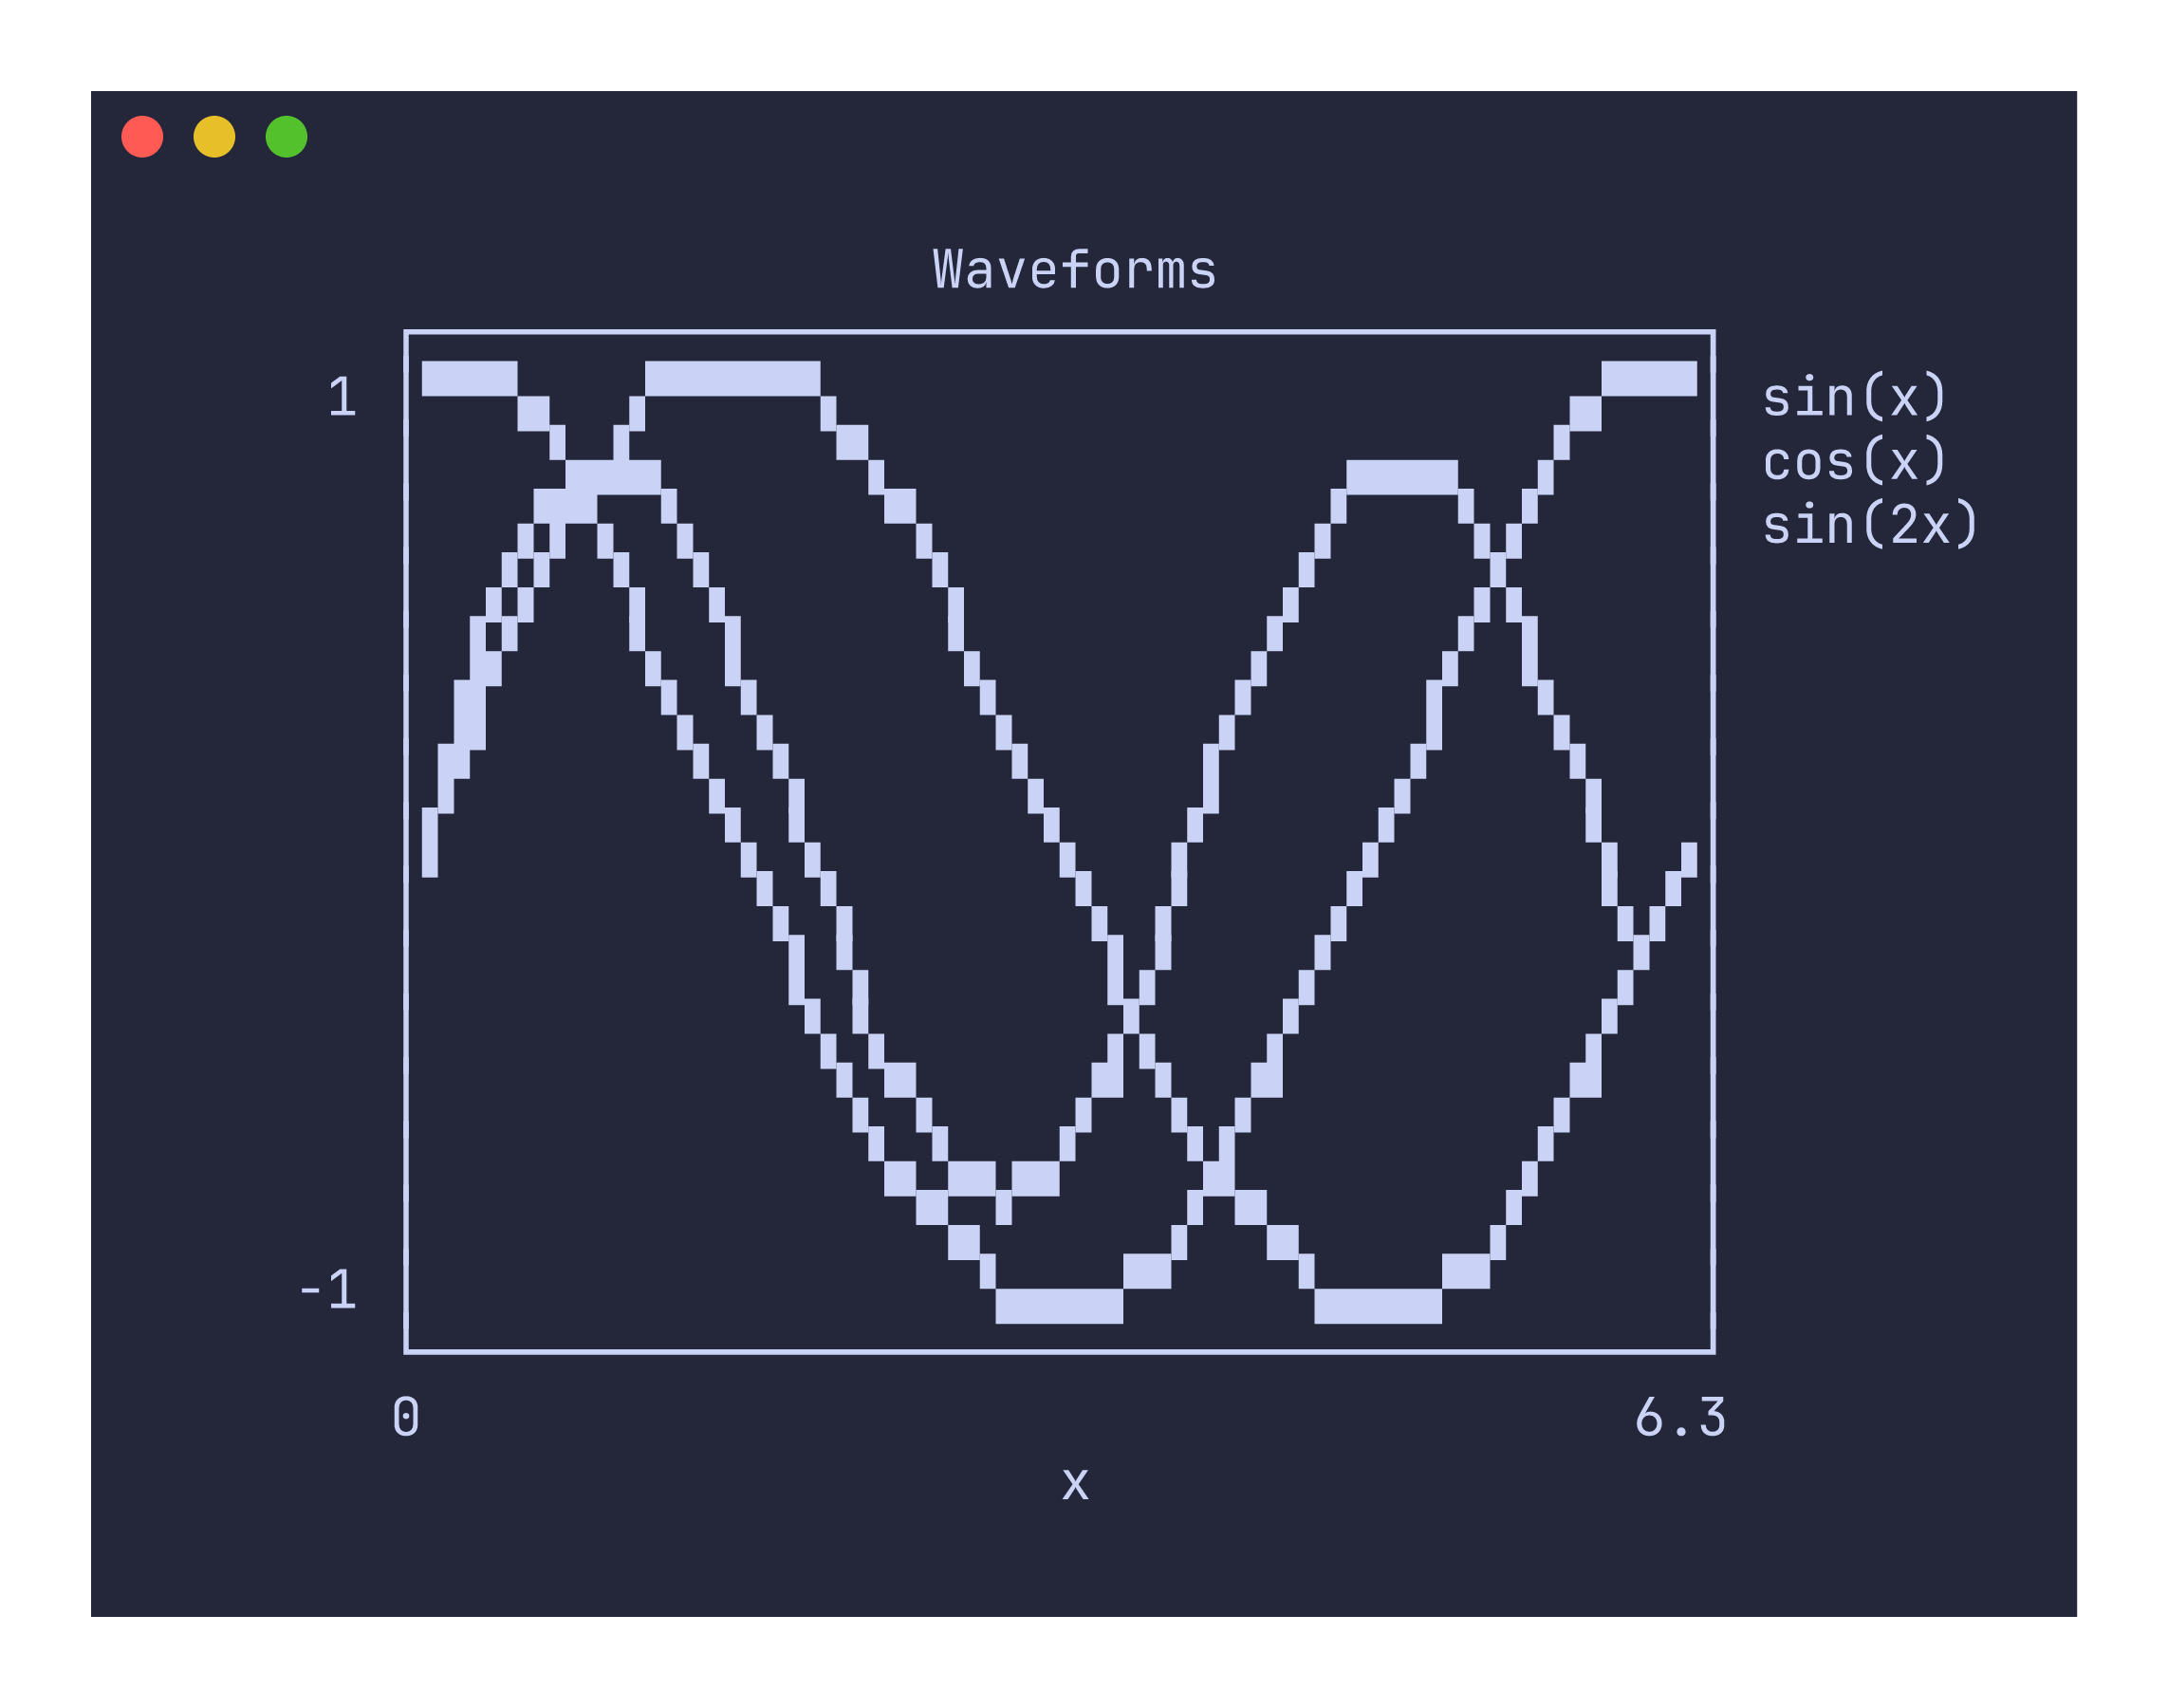
The lines command renders multiple series on the same line plot, each in a different color. It is designed for multi-column data where you want to compare several variables side by side.
Usage
uplot lines [options]
uplot lineplots [options]
uplot ls [options]
Input format
The default multi-series format is XYY: the first column provides shared x values and each subsequent column provides a separate y series. With a CSV header row (-H), column names become legend labels:
x,series_a,series_b,series_c
1,10,20,15
2,12,18,17
3,15,22,14
You can switch to XYXY format where columns are paired as x1,y1,x2,y2,… This is useful when each series has its own independent x values.
Example
uplot lines -H -d, --canvas block -t "Iris Measurements" < iris.csv
Colors and legend
Each series is automatically assigned a color from the palette (green, blue, red, magenta, yellow, cyan), cycling if there are more than six series. When headers are provided with -H, each series appears in the legend on the right side of the plot with its column name and color.
Command-specific options
| Flag | Description |
|---|---|
--canvas <TYPE> | Canvas type: braille (default), block, ascii, dot, density |
--grid / --no-grid | Toggle grid lines (default: on) |
--xlim <MIN,MAX> | X-axis limits |
--ylim <MIN,MAX> | Y-axis limits |
--fmt <FORMAT> | Data format: xyy (default, shared x) or xyxy (paired columns) |
The lines command requires at least two columns of data. If only one column is provided, it will return an error suggesting that you use the line command instead.
Non-numeric values in data columns are silently coerced to zero. This means mixed-type CSV files like the Iris dataset (which has a text species column) will not cause errors, but the non-numeric column will appear as a flat line at zero. If that is not useful, use cut to select only the numeric columns you want before piping to uplot.