scatter
Aliases: s
The scatter command renders individual data points on a canvas without connecting them with lines. Each point occupies a single pixel in the chosen canvas resolution, making scatter plots useful for visualizing the distribution and correlation of two variables.
Usage
uplot scatter [options]
uplot s [options]
Input format
Two or more columns of numeric data. The first column provides x values and the second provides y values. With multi-column CSV input and -H, additional columns are plotted as separate series:
uplot s -H -d, < iris.csv
Example
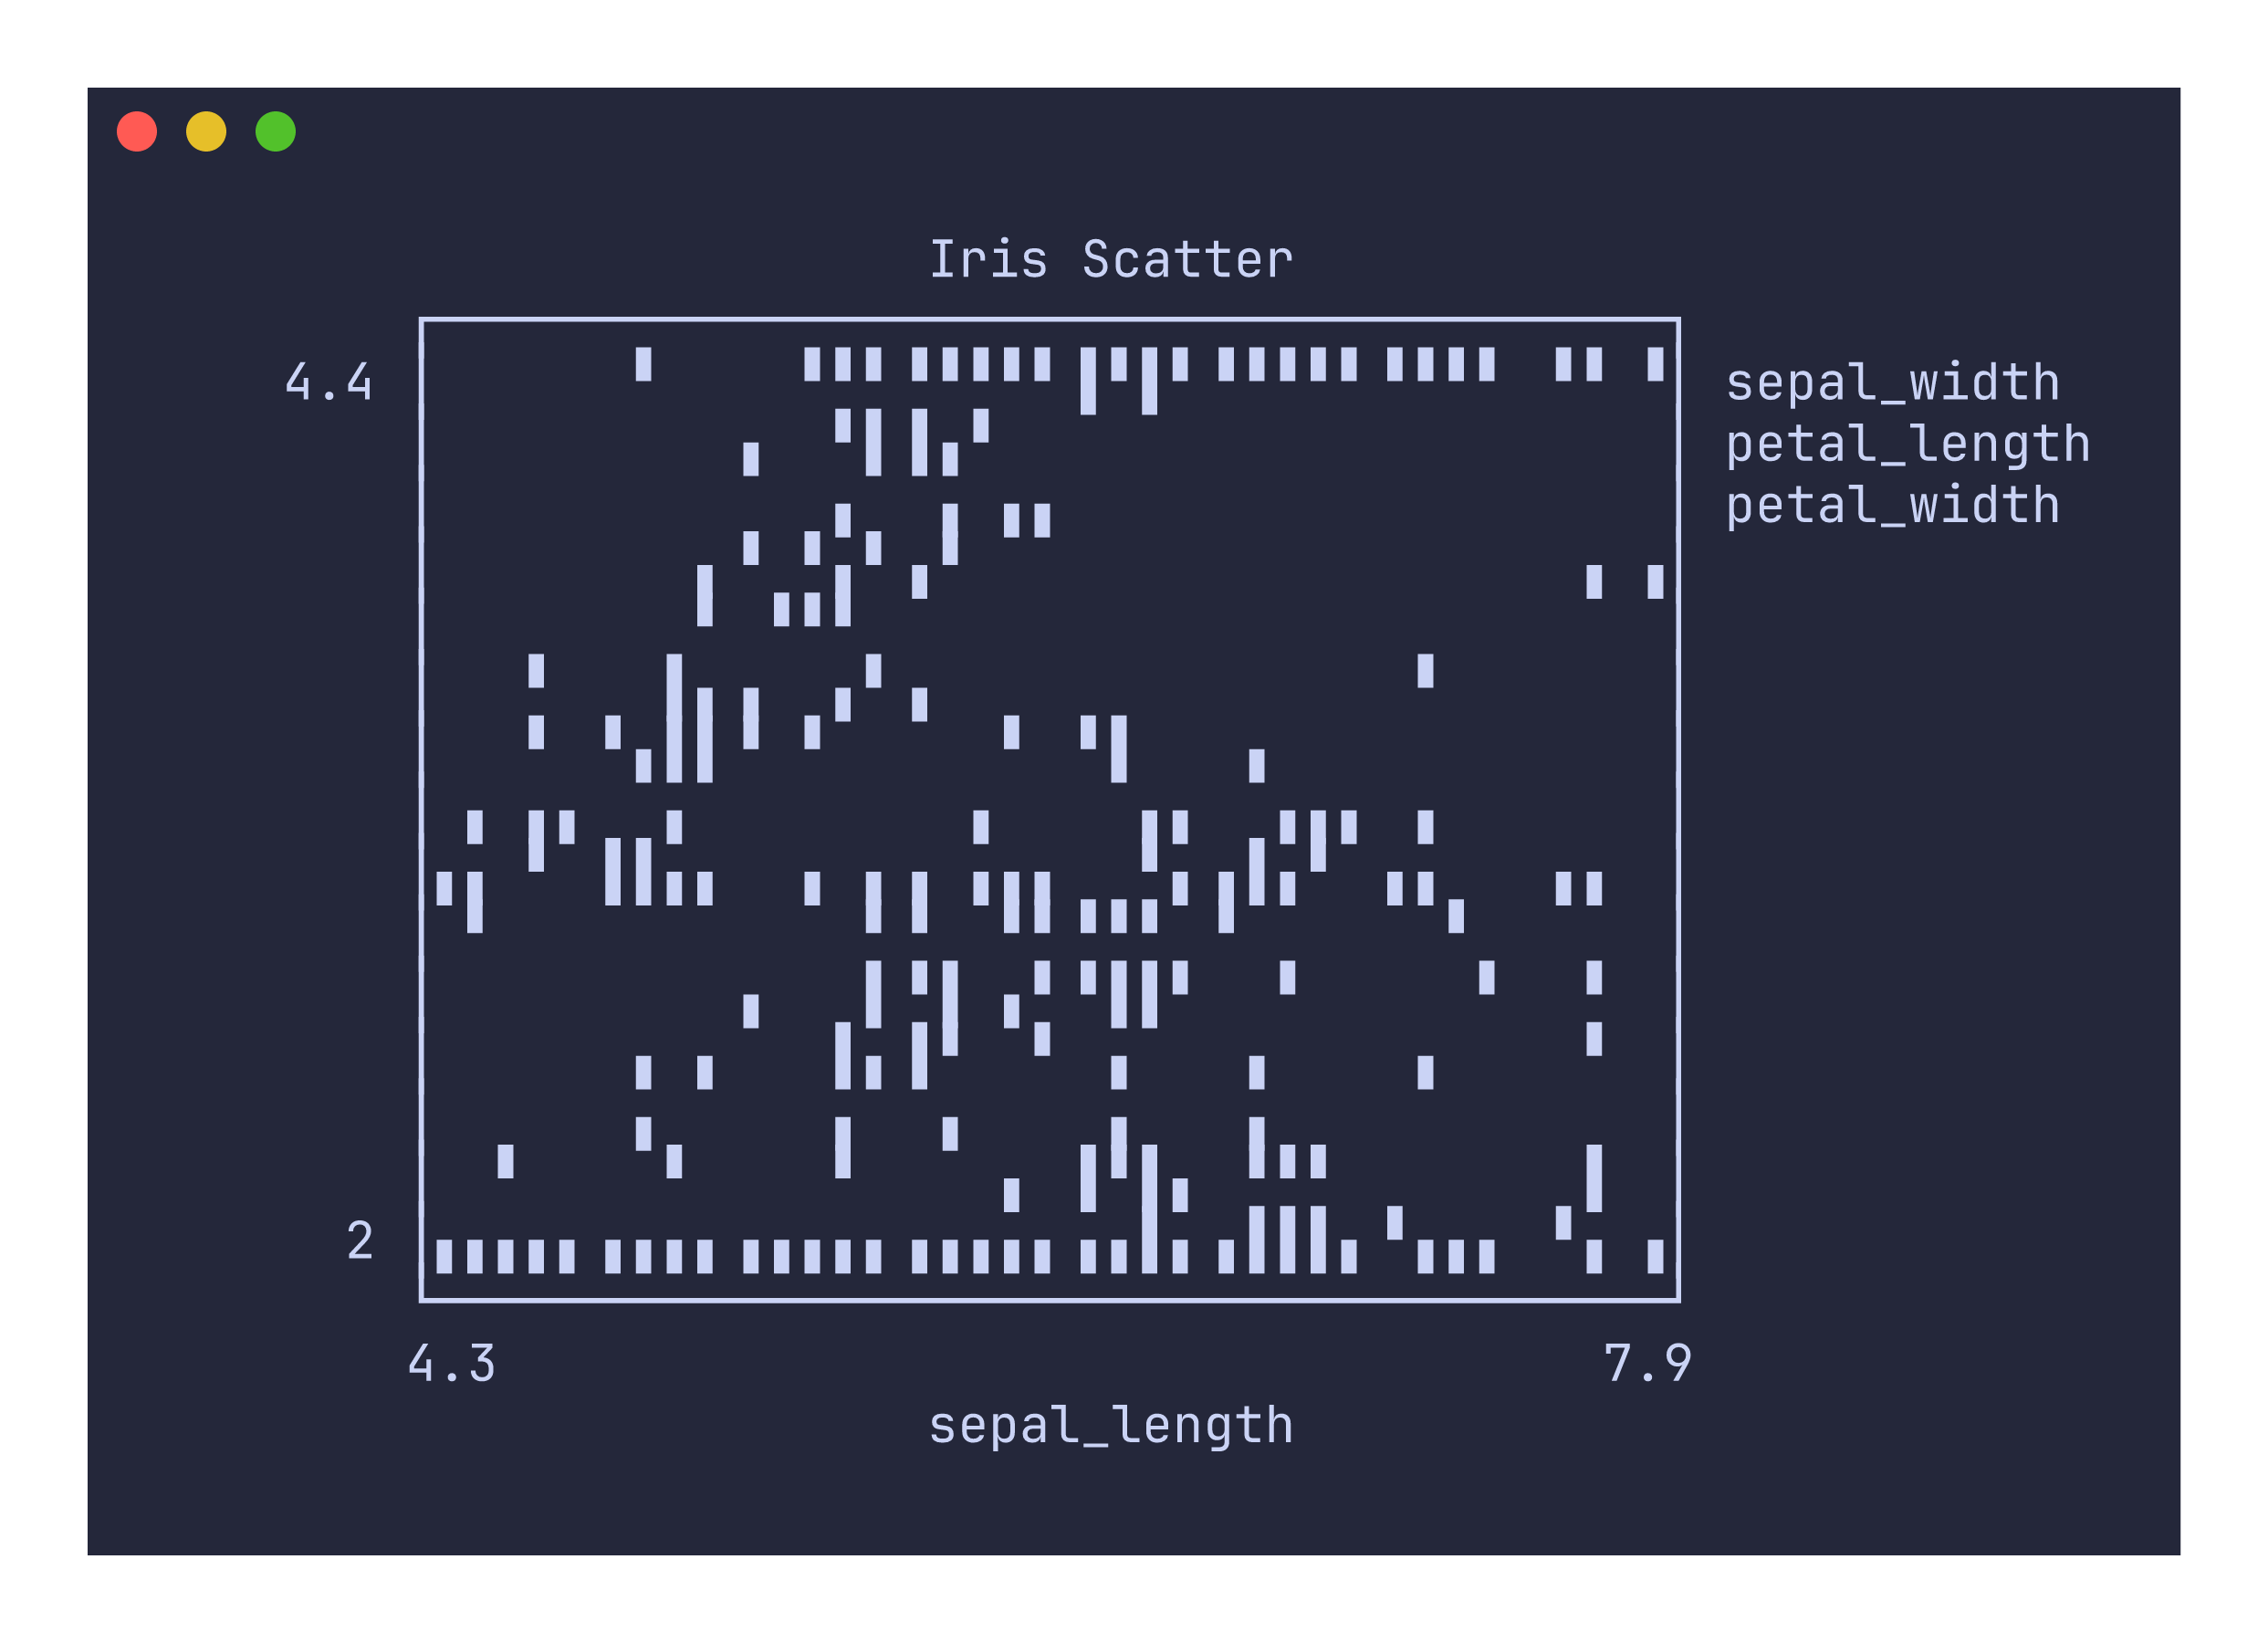
uplot s -H -d, --canvas block -t "Iris Scatter" < iris.csv
Canvas types
Like line plots, scatter plots default to the braille canvas. The block canvas is a practical alternative when braille glyphs are not available in your font:
uplot s --canvas block -H -d, < iris.csv
The density canvas is also available but is better accessed through the dedicated density command, which forces --no-grid and accumulates hit counts for overlapping points rather than treating each point equally.
Command-specific options
| Flag | Description |
|---|---|
--canvas <TYPE> | Canvas type: braille (default), block, ascii, dot, density |
--grid / --no-grid | Toggle grid lines (default: on) |
--xlim <MIN,MAX> | X-axis limits |
--ylim <MIN,MAX> | Y-axis limits |
--fmt <FORMAT> | Data format: xyy (default, shared x) or xyxy (paired columns) |
The scatter command requires at least two columns. Single-column input will produce an error. For single-column data, use line instead, which can plot y-only data against an implicit x index.
The visual difference between scatter and line is that scatter draws individual points while line connects consecutive points with segments. For the same data, a scatter plot will generally occupy fewer canvas cells than a line plot.